Budget Planning
bond yield curve, economic predictions, flat yield curve, impact of monetary policy on yield curve, interest rate predictions, investment strategies yield curve, normal vs inverted yield curve, UK bond market, UK gilt yield, yield curve inflation expectations, yield curve inversion, yield curve recession predictor
info@budgetplan.website
0 Comments
Understanding the Bond Yield Curve: A Key Indicator for Economic Predictions

The bond yield curve is a crucial tool in the financial markets, offering insights into the future direction of economies. For investors in the UK and around the globe, understanding how the yield curve functions can be instrumental in making informed financial decisions. This article delves into the intricacies of the bond yield curve, how it can predict economic trends, and its implications for investors.
What is the Bond Yield Curve?
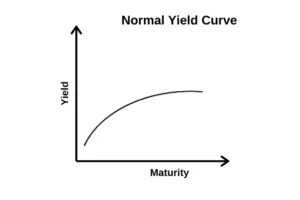
The bond yield curve is a graphical representation that shows the relationship between the interest rates (yield) and the maturity of the debt for a given borrower, such as the UK government. It typically displays short-term and long-term debt instruments.
Components of the Yield Curve
A standard yield curve consists of three primary segments: short-term, medium-term, and long-term maturities. These segments illustrate how yields on bonds vary with different maturities.
Normal vs. Inverted Yield Curve
In a normal yield curve, long-term bonds have higher yields than short-term bonds, reflecting the risks associated with time. Conversely, an inverted yield curve occurs when short-term interest rates exceed long-term rates, often seen as a predictor of economic recession.
Historical Context: Yield Curve as a Recession Predictor
Historically, an inverted yield curve has preceded several economic recessions. For instance, prior to the 2008 financial crisis, the yield curve inverted, signaling a forthcoming slowdown. The curve’s predictive power thus makes it a valuable indicator for economists and investors alike.
Flat Yield Curve
A flat yield curve occurs when there is little difference between short-term and long-term yields. This scenario typically indicates uncertainty or a transition period in the economic cycle.
Impact of Monetary Policy on the Yield Curve
Central banks, including the Bank of England, influence the yield curve through monetary policy. Interest rate adjustments and quantitative easing can impact the shape and direction of the yield curve.
Real-Life Example: UK Gilt Yield
The UK government bond, known as a gilt, provides a real-life context for observing the yield curve. Recent fluctuations in gilt yields have reflected economic sentiments and market anticipations regarding policy changes.
Yield Curve and Inflation Expectations
The yield curve can also reflect inflation expectations. A steep curve might indicate anticipated inflationary pressures, while a flatter curve may suggest subdued inflation expectations.
Investment Strategies Using the Yield Curve
Investors often use the yield curve to manage portfolio strategies. For instance, a steepening curve might prompt a shift to long-term bonds to capitalize on higher future yields.
Yield Curve and Interest Rate Predictions
The slope of the yield curve is a powerful indicator for predicting future interest rate movements. A steep curve suggests rising interest rates, while an inverted curve typically signals rate cuts.
Yield Curve and Credit Markets
Beyond government bonds, the yield curve impacts corporate credit markets. Changes in the curve can influence corporate bond spreads and borrowing costs for businesses.
Statistical Insights into the Yield Curve
According to the Bank of England, shifts in the yield curve can affect financial stability. Analysis of historical data shows that significant curve inversions have preceded every major UK recession since the 1980s.
Yield Curve Risks and Limitations
Despite its predictive power, the yield curve is not infallible. External factors such as geopolitical events, fiscal policy changes, or global economic shifts can alter its implications.
Monitoring Yield Curve Movements
For investors and policymakers, staying attuned to changes in the yield curve is crucial. Regular analysis can help in developing economic forecasts and adjusting investment strategies accordingly.
Conclusion: The Yield Curve as an Economic Compass
The bond yield curve remains an indispensable tool in both economic forecasting and investment strategy. By understanding its nuances, UK investors can better anticipate market trends, align their portfolio strategies, and make decisions that safeguard and grow their assets.
Whether for institutional investors or individual savers, integrating yield curve analysis into financial planning can enhance economic understanding and investment outcomes. It is essential, however, to consider the broader economic context and other indicators when interpreting the yield curve’s signals, ensuring well-rounded and informed decisions.
Disclaimer: This article uses the UK gilt as an example for illustrative purposes. Investors should conduct their own research or consult financial advisors before making decisions based on yield curve analysis.


Post Comment